In this article we compare CoralLog and Log4J in terms of latency and throughput. Benchmarks were conducted against asynchronous Log4J 2.0-rc2 using Disruptor 3.2.1.
Latency
As described in the article CoralLog Performance Numbers, we measure the time it takes to log each message in isolation, in other words, without any contention in the asynchronous queue. But this time, because Log4J does not have a drainAndWait method, we use a pause after logging each message so we can be sure the message has time to leave the queue and make it to the file before we send the next message. Then we proceed to compute the average time for one-million messages, with an initial warmup of 500,000 messages.
Note1: Thread-pinning was not used for both CoralLog and Log4J.
Note2: Log4J pauses before each message are NOT a good idea. It does NOT guarantee the absence of queue contention, although it helps in that direction. A pause will always be a noise in a latency benchmark.
CoralLog results:
Command-line:
java -server -verbose:gc -cp target/corallog-all.jar -DuseTimestamper=true -DmsgSize=64 -DmemoryMappedFile=true -DmemoryMappedBufferSize=max -DdetailedBenchmarker=true -DprocToBindProducer=-1 -DlogProcToBindConsumer=-1 -DlogAsynchronousQueueCapacity=512 -Ddelay=10000 -Diterations=1000000 -DbeforeStart=100000 -DconsumerWaitStrategy=park-backoff -DproducerWaitStrategy=park-backoff -DdelayMethod=ASSIGNMENT -DdeleteFile=true -DblockCount=true -DexcludeNanoTimeCost=true -DwarmupTimes=5 -DwarmupMessages=100000 -Xms2g -Xmx4g -XX:NewSize=512m -XX:MaxNewSize=1024m com.coralblocks.corallog.bench.PerformanceTest3
Messages: 1,000,000 (64 bytes)
Avg Time: 61.76 nanos
Min Time: 32.0 nanos
Max Time: 11.517 micros
Garbage creation: zero (no garbage is created)
75% = [avg: 52.0 nanos, max: 65.0 nanos]
90% = [avg: 56.0 nanos, max: 90.0 nanos]
99% = [avg: 60.0 nanos, max: 122.0 nanos]
99.9% = [avg: 61.0 nanos, max: 322.0 nanos]
99.99% = [avg: 61.0 nanos, max: 665.0 nanos]
99.999% = [avg: 61.0 nanos, max: 3.449 micros]
Log4J results:
Command-line:
java -server -verbose:gc -cp target/corallog-all.jar:lib/log4j-1.2-api-2.0-rc2-SNAPSHOT.jar:lib/log4j-api-2.0-rc2-SNAPSHOT.jar:lib/log4j-core-2.0-rc2-SNAPSHOT.jar:lib/disruptor-3.2.1.jar -DuseTimestamper=true -DmemoryMappedFile=true -DmemoryMappedBufferSize=max -DdetailedBenchmarker=true -DprocToBindProducer=-1 -DlogProcToBindConsumer=-1 -DlogAsynchronousQueueCapacity=512 -Ddelay=10000 -Diterations=1000000 -DbeforeStart=100000 -DconsumerWaitStrategy=park-backoff -DproducerWaitStrategy=park-backoff -DdelayMethod=ASSIGNMENT -DdeleteFile=false -DmsgSize=64 -DblockCount=true -DexcludeNanoTimeCost=true -DwarmupTimes=5 -DwarmupMessages=100000 -DlogLibrary=LOG4J -DLog4jContextSelector=org.apache.logging.log4j.core.async.AsyncLoggerContextSelector -Dlog4j.configurationFile=lib/perf3PlainNoLocWithTimestamp.xml -Xms2g -Xmx4g -XX:NewSize=512m -XX:MaxNewSize=1024m com.coralblocks.corallog.bench.PerformanceTest3
Messages: 1,000,000 (64 bytes)
Avg Time: 890.44 nanos
Min Time: 68.0 nanos
Max Time: 13.404 millis
Garbage creation: the more messages you write the more garbage is created
75% = [avg: 682.0 nanos, max: 1.196 micros]
90% = [avg: 770.0 nanos, max: 1.243 micros]
99% = [avg: 818.0 nanos, max: 1.558 micros]
99.9% = [avg: 844.0 nanos, max: 11.402 micros]
99.99% = [avg: 854.0 nanos, max: 15.097 micros]
99.999% = [avg: 857.0 nanos, max: 41.479 micros]
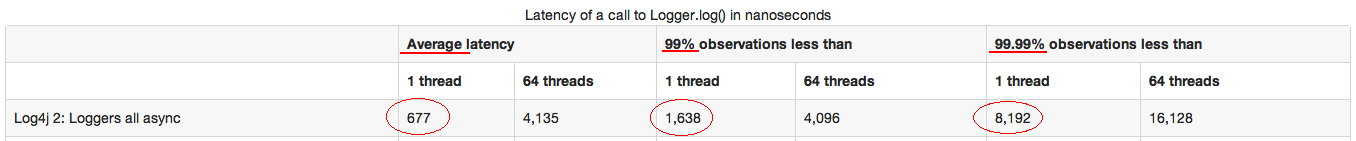
Log4J official numbers:
Throughput
Note: Thread-pinning was not used for both CoralLog and Log4J.
CoralLog results:
Time to send 1,000,000 messages with 64 bytes: 0.231396475 seconds
Avg time per message: 231.0 nanos
Messages per second: 4,321,587
Garbage creation: zero (no garbage is created)
Log4J results:
Time to send 1,000,000 messages with 64 bytes: 0.330282985 seconds
Avg time per message: 330.0 nanos
Messages per second: 3,027,707
Garbage created for the GC: The more messages you write the more garbage is created
Log4J official results:

Conclusion
- CoralLog has an average latency 14 times lower than Log4J (61 nanos x 890 nanos)
- CoralLog produces zero garbage. Log4J produces garbage in proportion to the number of messages written.
- CoralLog has lower variance than Log4J, with a max latency of 11.517 micros against 13.404 millis from Log4J.
- At the 99.99 percentile, CoralLog shows an average latency of 61 nanos with a max latency of 665 nanos. Log4J shows for the same percentile an average latency of 854 nanos with a max latency of 15 micros.
- CoralLog has an average throughput 30% greater than Log4J (4,321,587 x 3,027,707) without producing any garbage while LOG4J produces a lot of garbage.